Rain is life — it fills rivers, feeds crops, and creates lush landscapes. But when we map the places where rain is most abundant, we find a fascinating mix: equatorial islands, mountainous tropical regions, and coastal zones where geography traps moisture. This article walks through the rainiest countries by long-term average annual precipitation, explains why these places are wet, and explores what heavy rainfall means for people, infrastructure, and the environment.
Data note
Primary metric: average annual precipitation (millimeters per year) at country level, using long-term country averages compiled from World Bank / national meteorological observations and collated in public datasets (see sources).
What “rainiest” means here: country-level long-term average precipitation — not single-site records (like Mawsynram or Cherrapunji, which are towns with exceptional local rainfall). Country averages smooth local extremes but show which national territories receive the most rain overall.
Caveat: national averages can mask internal variation (a wet mountain region may coexist with dry lowlands). Where possible we point out these nuances.
Top-10 Rainiest Countries (illustrative national averages, mm/year)
Note: the values below are illustrative long-term national averages compiled from public datasets (World Bank / Wikipedia / VisualCapitalist / WorldAtlas) and are provided to orient readers;
Colombia — ~3,240 mm/yr.
São Tomé and Príncipe — ~3,200 mm/yr.
Papua New Guinea — ~3,200 mm/yr.
Solomon Islands — ~3,028 mm/yr.
Panama — ~2,928 mm/yr.
Costa Rica — ~2,926 mm/yr.
Grenada — ~2,350 mm/yr.
Peru — ~2,348 mm/yr.
Ecuador — ~2,331 mm/yr.
Brazil — ~2,330 mm/yr.
Why these countries are so wet — three core drivers
Orographic lift — Moist air pushed by winds up mountain slopes cools and releases precipitation (e.g., mountains of Papua New Guinea, Andean foothills in Colombia/Ecuador/Peru).
Equatorial moisture & trade winds — Islands and coastal zones near the ITCZ (Intertropical Convergence Zone) or influenced by warm ocean currents receive steady moisture year-round (Solomon Islands, São Tomé).
Monsoon and seasonal convergence — Regions that sit under monsoon belts (parts of northern South America, Central America) get large seasonal totals concentrated in a few months.
Short country notes (what heavy rain means locally)
Colombia — High rainfall supports Amazon and Andean cloud forests; at the same time, intense rainfall events create landslides and flash floods in mountain communities.
São Tomé and Príncipe — Island rainfall sustains moist tropical forests but raises concerns about erosion, infrastructure resilience, and freshwater management.
Papua New Guinea — Mountainous terrain plus the NW Pacific moisture trains yield enormous totals; access and road maintenance are perennial challenges.
Solomon Islands — Frequent heavy rains and tropical storms mean water-driven hazards and coral reef sedimentation issues.
Panama & Costa Rica — Rainforests and cloud forests with rich biodiversity; but heavy rainfall complicates road access and can accelerate landslides.
Peru, Ecuador — Rain is concentrated on Amazon-facing slopes and parts of the Andes — agriculture and transport must adapt to high runoff.
Brazil — Northern Brazil and Amazon basin receive the bulk of rainfall; seasonal flooding is an ecological feature but infrastructure is threatened in populated zones.
Grenada — Caribbean islands can be very rainy regionally (and also face cyclones that dump enormous monthly totals).
Future trends & what to watch
Climate change will shift rainfall patterns: models indicate some wet regions may get wetter while many subtropical zones become drier — but local outcomes vary. Intense short-duration rainfall events (flash floods) are expected to become more frequent.
Infrastructure resilience matters: being rainy isn’t inherently bad — ecosystems thrive — but human settlements must invest in drainage, slope stabilization, resilient roads, and floodplain planning.
Data gaps: island nations and remote mountains may have sparse long-term station coverage; improved monitoring will refine these rankings.
QA — quick answers
Q: Are these the ‘wettest places on Earth’ like Mawsynram? A: Not exactly. Towns like Mawsynram (India) or Lloró (Colombia) can exceed 10,000 mm/yr locally; these are site-specific extremes. The country-level list averages across territories.
Q: Why does this list look mostly tropical? A: Tropical and equatorial climates have abundant moisture and convective rainfall; orographic zones trap that moisture, producing very high annual totals.
Conclusion (warm note)
Rain shapes landscapes, livelihoods and cultures. The rainiest countries brim with biodiversity and water wealth — and their heavy rains also require thoughtful adaptation. Understanding where and why it rains most helps governments and communities plan for life in the wet season: turning water into abundance, not disaster.
Top 10 Strongest Militaries in the World (2026 Rankings) When discussing the “strongest militaries in the world,” many people focus solely on the number of soldiers or tanks. However, in 2026, true military power is defined by a complex fusion of technological superiority, logistical reach, cyber capabilities, and economic endurance. This guide moves beyond simple…
Contents1 Introduction2 Methodology3 Ranking (In Order)4 Country Profiles (Detailed by Three Dimensions for Each Country)5 Why Do These Countries Rank at the Top?6 Trend Prediction: The Landscape of Sports Powerhouses in the Next 5 Years7 Conclusion8 Data Sources Introduction Sports are not just about winning or losing; they are a vital indicator of national health,…
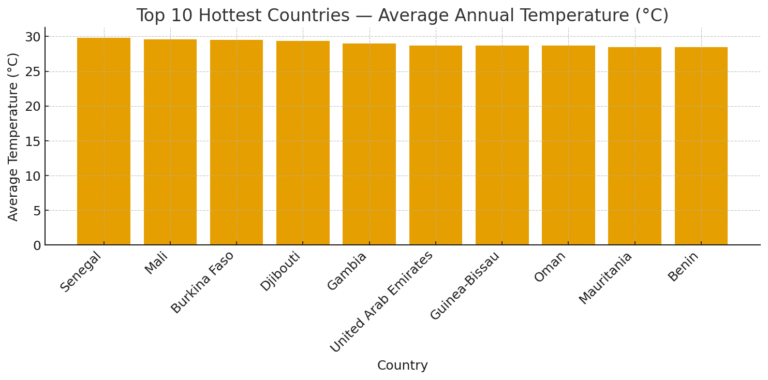
Contents1 Introduction2 Data Explanation (Methods & Sources)3 Ranking4 Country Profiles5 Future Trends6 Q&A (Frequently Asked Questions)7 Conclusion8 Data Sources Introduction The definition of “hottest” may seem intuitive, but it is multifaceted. Some define it as the extreme high temperature recorded in a given year, others by the highest average summer temperature, while others focus on…
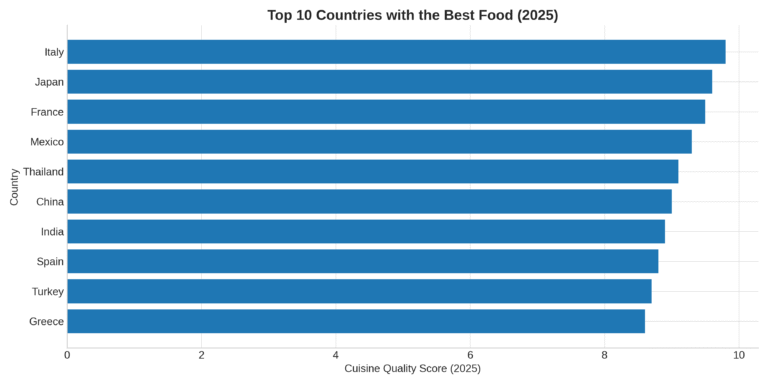
Contents1 1. Introduction2 2. Top 10 Best Cuisine Countries — Overview Table3 3. What Makes a Cuisine Truly the “Best”4 4. Country-by-Country Analysis5 5. Culinary Trends & Future Outlook6 6. FAQ — About Best Cuisine Countries7 7. Data Sources & Methodology8 8. Conclusion 1. Introduction Food is more than just sustenance – it reflects history,…
Contents1 Introduction2 Data Explanation3 Ranking — Top 10 Countries / Regions by Life Expectancy4 In-Depth Country/Region Analysis: Why Do They “Live Longer”?5 Future Trends6 Q&A (Frequently Asked Questions)7 Conclusion8 Data Sources Introduction Everyone seeks longevity, but places that truly achieve long life spans are never accidental. Globally, some countries and regions, leveraging advanced healthcare, high-quality…
Introduction When it comes to dogs, it’s safe to say many people adore them. Dogs can be categorized by size into extra-small, small, medium, large, and extra-large breeds. Medium-sized dogs are generally defined as those weighing between 11–30 kg and standing 41–60 cm tall when fully grown. So, which medium-sized breeds are the most worthwhile…