Top 10 Hottest Countries in the World
Contents
Introduction

The definition of “hottest” may seem intuitive, but it is multifaceted. Some define it as the extreme high temperature recorded in a given year, others by the highest average summer temperature, while others focus on the long-term Mean Annual Temperature. This article uses the “Long-Term Mean Annual Temperature” (CMIP6 / 1991–2020 or a similar 30-year baseline) as the primary metric, reflecting the perennial climatic heat load and facilitating international comparison. We also consider extreme heatwaves and warming rates as supplementary dimensions, due to their significant impact on human health, agriculture, and infrastructure.
Data Explanation (Methods & Sources)
Primary Ranking Basis
The main ranking is based on WorldPopulationReview‘s compilation of country-level average annual temperatures (CMIP6 / 1991–2020 baseline). This data integrates multi-year day and night averages into a single “Average Annual Temperature (°C)” value.
Supplementary Climate Evidence
To discuss annual anomalies and long-term warming, we reference analyses from WMO (e.g., 2024 as a record-hot year), NOAA annual reports, and Berkeley Earth global warming studies.
Ranking

Note: Values represent the long-term Mean Annual Temperature (°C) as listed in WorldPopulationReview’s summary. Slight variations may occur with different methodologies.
| Rank | Country | Mean Annual Temp. (°C) | Source |
|---|---|---|---|
| 1 | Senegal | 29.8 | World Population Review |
| 2 | Mali | 29.6 | World Population Review |
| 3 | Burkina Faso | 29.5 | World Population Review |
| 4 | Djibouti | 29.4 | World Population Review |
| 5 | Gambia | 29.0 | World Population Review |
| 6 | United Arab Emirates | 28.7 | World Population Review |
| 7 | Guinea-Bissau | 28.7 | World Population Review |
| 8 | Oman | 28.7 | World Population Review |
| 9 | Mauritania | 28.5 | World Population Review |
| 10 | Benin | 28.5 | World Population Review |
Country Profiles
Each profile explains the primary reasons for the high temperature, its societal impacts, and key vulnerabilities, supported by geographical context and climate data.
Senegal — 29.8 °C

Primary Factors: Located in the West African Sahel/semi-arid zone, near the northern edge of the equator; long dry season with minimal diurnal temperature variation. Impacts: Threat to agro-pastoral production from drought; urban heat island effect and water supply pressure.
Adaptation Focus: Water resource management, drought-resistant agriculture, and urban greening.
Mali — 29.6 °C

Primary Factors: Inland Sahara/Sahel transition zone characterized by vast deserts and low rainfall.
Impacts: Significant heatwave impact on outdoor laborers and food security.
Adaptation Focus: Strengthening cold chains, health emergency response, and food security systems.
Burkina Faso — 29.5 °C

Primary Factors: Part of the Sahel region; high average temperatures coincide with increasingly extreme intermittent heavy rainfall.
Impacts: pronounced social impacts, particularly on rural agriculture and pastoralism.
Djibouti — 29.4 °C
Primary Factors: Northeast Africa, bordering the Red Sea; high marine evaporation leads to intense humid heat. Impacts: exacerbated heat in coastal cities, compounded by sea-level rise threats.
Gambia — 29.0 °C
Primary Factors: Small tropical country where climate change is increasing seasonal extremes.
Impacts: High baseline temperature.
Adaptation Focus: Coastal community adaptation and public health initiatives.
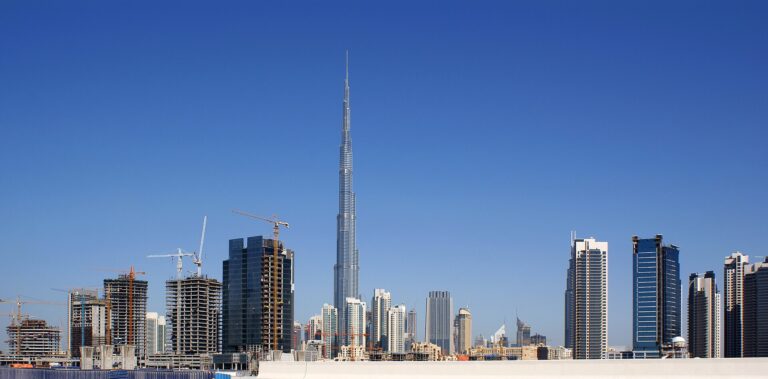
United Arab Emirates — 28.7 °C
Primary Factors: Desert climate of the Arabian Peninsula intensified by urban heat island effect; extreme summer heat.
Impacts: immense energy demand for cooling; increasing public health burden from heat-related illnesses.
Guinea-Bissau — 28.7 °C
Primary Factors: Tropical coastal climate, hot and humid; highly sensitive to climatic variations (e.g., sea temperature changes affecting agriculture/fisheries).
Oman — 28.7 °C
Primary Factors: Semi-arid to desert climate, with varying heat load between coast and interior.
Impacts: Key challenges in freshwater supply and coastal zone management.
Mauritania — 28.5 °C
Primary Factors: Bordering the Sahara; desertification and land degradation compound heat load and ecological vulnerability.
Benin — 28.5 °C
Primary Factors: Tropical climate with significant inland/coastal variation, but overall high annual average.
Impacts: places pressure on agriculture and urban services.
Future Trends
Global Warming Context
Data from WMO, NOAA, and Berkeley Earth confirm recent decades as the hottest on record. This means the list of “hottest countries” will shift upward, with originally hot places becoming hotter, and more regions facing compound impacts from heatwaves, droughts, and rising sea temperatures.
Extremes Outweigh Averages
The greatest human impact often stems from short-term extreme heat (heatwaves) rather than the mean annual temperature. Adaptation must prioritize emergency response capacity: cooling centers, healthcare, labor protection, and food/water security.
Urbanization & Heat Islands
Urbanization in high-temperature countries exacerbates local heat loads. Sustainable urban planning (green spaces, reflective materials, ventilation corridors) is crucial for long-term adaptation.
Q&A (Frequently Asked Questions)
Q: Why are some hot island nations not in the top ten?
A: Oceanic moderation often results in lower average annual temperatures compared to inland arid zones like the Sahara/Sahel, despite high humidity and other threats (sea-level rise, storms). The ranking metric (mean temperature vs. extremes) determines inclusion.
Q: Will these average temperatures change rapidly?
A: Mean annual temperatures rise gradually, but the frequency and intensity of heatwaves and regional extremes are increasing more rapidly, as noted in recent WMO/NOAA reports.
Q: How should readers interpret this “hottest” ranking?
A: View it as a risk indicator. High average temperatures and frequent extremes necessitate robust adaptation strategies for public health, food/water security, energy, and infrastructure. Focus on local government and international efforts to enhance emergency and long-term adaptation plans.
Conclusion

“Heat” is not merely a physical metric; it affects the worker at dawn, the elderly without air conditioning, and the farmer in drought. Rankings highlight vulnerability, but the imperative is turning data into action: better heat-health protection, equitable water distribution, and sustainable land use. Data identifies where it is hot; informed policy and human compassion are what make life there safer and more livable.
Data Sources
WorldPopulationReview — “Hottest Countries in the World (CMIP6 / 1991–2020 summary)” World Population Review
WMO — World Meteorological Organization press release (2024 warmest year confirmation) World Meteorological Organization
NOAA / NCEI — Global Climate Reports (Annual 2023 / 2024 summaries) noaa
Berkeley Earth — Global Temperature Report for 2024 Berkeley Earth
The Guardian / AP / FT theguardian